Whole-home off-grid energy system design
Educational use only
This page is for educational purposes only. Hands-on skills should be learned and practiced under qualified supervision before relying on them in emergencies. Use this information at your own risk.
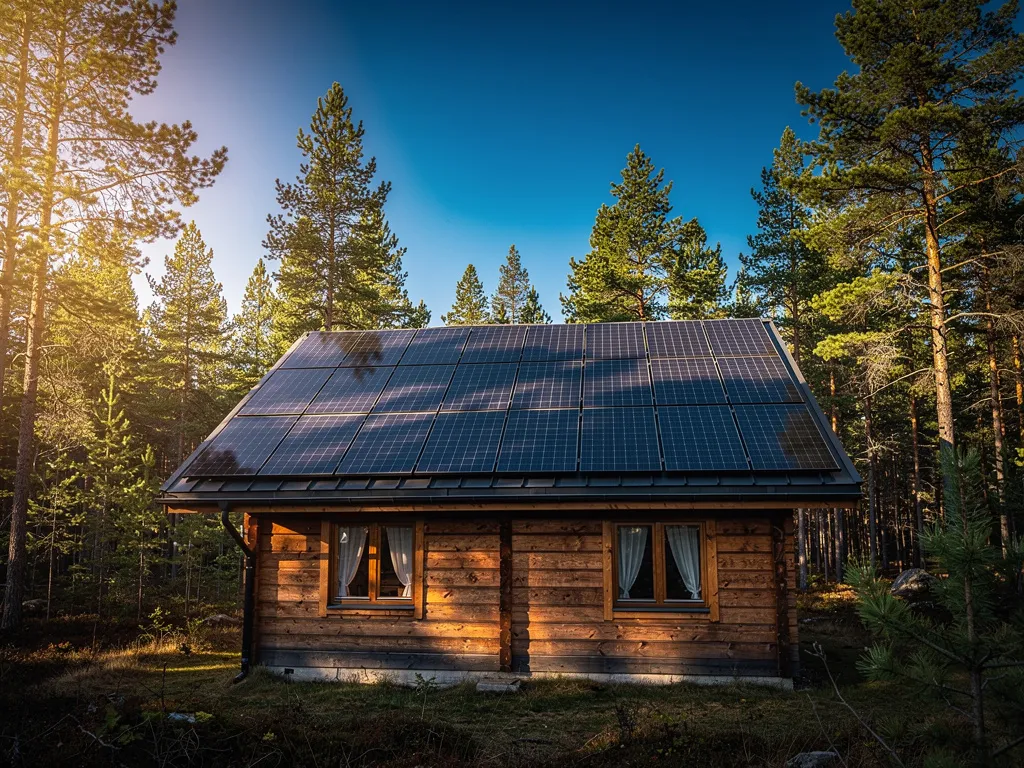
A whole-home off-grid energy system produces, stores, and delivers every watt your household consumes without any utility connection. The design decisions that determine whether it works reliably — or requires a generator rescue every January — are made before the first component arrives. Most off-grid failures trace back to one of three mistakes: undersizing the battery bank because the load audit was lazy, mismatching panel array capacity to actual winter sun hours, or selecting components from different voltage tiers that don't integrate cleanly. This page walks through the complete design sequence in the order it has to happen.
Before you start
Skills: Competence with DC electrical concepts (voltage, current, series/parallel circuits, Ohm's Law). Understanding of basic solar panel specifications (Voc, Vmp, Isc) from solar basics and familiarity with DIY solar installation sequencing. Comfort with permit applications and reading local building codes. Whole-home system wiring requires a working knowledge of NEC 690 (solar PV), NEC 706 (energy storage systems), and NEC 710 (stand-alone systems) — not a licensed electrician, but not a beginner's first project. NFPA 855 also applies to residential ESS installations.
Materials: Room-by-room load list and a plug-in power meter (affordable from any hardware store) to measure actual device draw; worst-month peak sun hours for your location (free via NREL PVWatts); site access for any wind or hydro resource assessment. Hardware purchases follow after sizing — do not buy components before completing Steps 1–4.
Conditions: Confirm your site's sun exposure, wind potential, and stream access before committing to a generation mix. Verify local permitting requirements for permanently installed off-grid systems — most jurisdictions require an electrical permit for any system with a battery bank or grid-interactive inverter. A whole-home system is a multi-week to multi-month project; plan accordingly.
Time: Design phase (Steps 1–5) — 10–20 hours spread over several days. Component procurement — 1–4 weeks lead time. Physical installation for a whole-home system — several days to weeks depending on scale and complexity. Permit inspection adds 1–6 weeks in most jurisdictions.

Step 1 — Audit every load in your home
The load audit is the foundation every other calculation rests on. A number pulled from a general rule of thumb ("the average home uses 30 kWh per day") will produce a system that is either wildly oversized and over-budget or embarrassingly undersized.
How to conduct a complete load audit:
- Walk every room and list every electrical device — lights, appliances, tools, electronics, HVAC equipment, well pump, water heater, phone chargers, entertainment systems. Leave nothing out.
- For each device, record: nameplate watts (from the label, usually on the back or bottom), average daily hours of use (be honest — two hours a day is not three), and frequency (daily, or three times per week, or seasonal only).
- Calculate Wh/day for each device: watts × hours per day. For devices used less than daily, calculate weekly Wh and divide by seven.
- Separate the list into two columns: summer and winter. Air conditioning runs in summer; space heating fans and long lighting hours run in winter. Your off-grid system must be designed for the harder season at your location.
- Sum the total Wh/day for each season. This is your baseline household load.
Sample partial audit table:
| Device | Watts | Hours/day | Wh/day |
|---|---|---|---|
| Refrigerator (Energy Star) | 60 W avg | 24 h | 1,440 |
| Chest freezer (medium) | 40 W avg | 24 h | 960 |
| LED lighting (8 fixtures) | 60 W | 5 h | 300 |
| Well pump (1/2 HP) | 750 W | 0.5 h | 375 |
| Laptop × 2 | 90 W | 6 h | 540 |
| Continuous positive airway pressure (CPAP) machine | 30 W | 8 h | 240 |
| Phone and device charging | 40 W | 3 h | 120 |
| Furnace blower (ECM motor) | 150 W | 4 h | 600 |
| Critical load daily total | ~4,575 Wh | ||
| Electric oven | 2,400 W | 0.5 h | 1,200 |
| Clothes dryer | 5,000 W | 0.5 h | 2,500 |
| Full household daily total | ~8,275 Wh |
The gap between 4,575 Wh (critical loads) and 8,275 Wh (full household) is your discretionary load buffer — the appliances you shed when production is low.
Well pump and water-system loads require special attention. The 375 Wh/day estimate in the table above is for a 1/2 HP pump running 30 minutes per day — a reasonable baseline for a household well with a pressure tank. However, surge current at motor start (approximately 6× full-load amperage per NEMA Design B) means the inverter must handle 750–1,000 W instantaneous peak, not just the 375 W nameplate. If your household includes livestock, irrigation, or a cistern-fill operation, daily pump runtime can multiply 5–10×, significantly increasing the water-system contribution to your energy budget. Measure or estimate your actual daily pump runtime before finalizing your load audit. For well-pump specs and gravity-fed alternatives that eliminate pump power requirements entirely, see Wells and Cisterns.
Field note
A smart plug with energy monitoring costs very little and measures actual watts consumed, not nameplate maximums. Nameplates list worst-case draw, not average draw. A refrigerator labeled 150 W typically averages 40-70 W because the compressor cycles. Measure for a week before finalizing your audit numbers — the difference between nameplate and actual is often 30-50%.
Step 2 — Separate loads into three tiers
Before sizing any component, explicitly categorize each load. This classification drives every subsequent design decision.
Critical loads (size the system around these): - Medical equipment: CPAP, oxygen concentrators, insulin refrigerators - Refrigerator and chest freezer (food safety requires continuous power) - Well pump (potable water) - Basic LED lighting (safety and navigation) - Communications: router, radio, phone charging - Furnace or heat pump controls (blower motor, not burner) in cold climates
Essential loads (designed in, but can shed for 24-48 hours): - Hot water heater (if electric — consider propane or solar thermal instead) - Laptop and work equipment - Washing machine
Discretionary loads (shed immediately during low production): - Electric oven, microwave, and range - Clothes dryer — air-dry instead - Window air conditioning units - Power tools and workshop equipment - Entertainment systems
Design your battery bank and solar array to reliably power critical loads indefinitely and essential loads for most days. Discretionary loads run on surplus.
Step 3 — Size the battery bank
Battery sizing translates your critical load requirement into amp-hours of storage at a specific system voltage. Work through these four steps:
Step 3a — Choose your target autonomy window. Autonomy is how many consecutive days the battery bank can power critical loads with zero solar or wind input.
- 2 days: minimum reasonable floor; fine in the American Southwest or other high-sun regions
- 3 days: standard design target for most US climates
- 4–5 days: appropriate for the Pacific Northwest, northern Great Lakes, or any location with frequent multi-day cloud cover
Step 3b — Calculate raw capacity needed.
Battery capacity (Wh) = Critical daily load (Wh) × Autonomy days ÷ Usable DoD
Using the example above: 4,575 Wh critical load, 3-day autonomy, LiFePO4 at 90% usable DoD:
4,575 Wh × 3 days ÷ 0.90 = 15,250 Wh (15.25 kWh)
For AGM lead-acid at 50% usable DoD:
4,575 Wh × 3 days ÷ 0.50 = 27,450 Wh (27.45 kWh) — nearly double the nameplate capacity
This is why LiFePO4 wins on usable capacity despite the higher upfront cost. See the batteries page for a full chemistry comparison and lifetime cost analysis.
Step 3c — Add a buffer for losses and aging.
Add 15–20% for inverter conversion losses (typically 5–8%) and capacity aging (LiFePO4 loses roughly 20% capacity over 10 years of daily cycling):
15,250 Wh × 1.18 = 17,995 Wh — round up to 20 kWh
Step 3d — Select system voltage and convert to amp-hours.
For any whole-home system above 2 kW or any battery bank above 10 kWh, design at 48V. The reasons are physical: a 3,000W inverter draws 62.5A from a 48V bank and 250A from a 12V bank. Quarter the current, quarter the required cable cross-section, and dramatically reduce resistive heat losses throughout the system.
20,000 Wh ÷ 48V = 416 Ah at 48V
Two 48V 200Ah server-rack LiFePO4 batteries (400 Ah combined) come within 4% of this target — close enough. A 48V 100Ah unit is a common modular size, so four units in parallel covers this bank at a total of 400 Ah.
Never mix battery chemistries in one bank
LiFePO4 and lead-acid batteries have different charge voltage profiles. A charger configured for LiFePO4 (absorption at 57.6V for 48V bank) will overcharge and damage AGM batteries. A charger configured for AGM will chronically undercharge LiFePO4, causing cell imbalance. Same chemistry, same capacity, same age — within one bank, no exceptions.
Step 4 — Size the solar array
Solar array sizing determines whether the system can replenish the battery bank within a typical production day. The critical variable is peak sun hours (PSH) — not total daylight hours, but the hours of sunlight intense enough to operate panels at rated output.
PSH by region at worst month (typically December/January in North America):
| Region | Worst-month PSH |
|---|---|
| Southwest US (AZ, NM, NV) | 4.5–6.5 |
| Southeast US (FL, GA, TX coast) | 3.5–4.5 |
| Midwest (IL, OH, MI) | 2.5–3.5 |
| Pacific Northwest (OR, WA) | 1.5–2.5 |
| Northeast (NY, MA, VT) | 2.5–3.5 |
| Rocky Mountains (CO, UT) | 4.0–5.5 |
Array sizing formula:
Array watts = Daily production target (Wh) ÷ Worst-month PSH ÷ 0.80 derate
The 0.80 derate accounts for real-world losses: panel temperature derating (panels lose about 0.35% output per degree Celsius above 77°F (25°C) standard test condition), soiling, wiring losses, and maximum power point tracking (MPPT) charge controller efficiency.
For 4,575 Wh critical load plus 20% recharge margin = 5,490 Wh daily production target, at 3.0 PSH worst-month (Midwest):
5,490 Wh ÷ 3.0 h ÷ 0.80 = 2,288W nameplate panel capacity — minimum
For a system designed to run full household loads (8,275 Wh) plus recharge margin:
8,275 Wh × 1.20 ÷ 3.0 h ÷ 0.80 = 4,138W panel array
At 400W per modern panel, the critical-load-only design (2,288W) requires approximately 5–6 panels at 3.0 PSH, while the full-household design (4,138W) requires approximately 10–11 panels at the same Midwest worst-month scenario. In the Pacific Northwest at 2.0 PSH, the full-household design rises to approximately 15–16 panels.
Field note
Size the array for winter, not summer. A system that barely covers loads in January produces large surpluses in June and July — and that's fine. Surpluses can dump into a water heater element (resistive heating is a perfect dump load), charge tools, or power seasonal high-draw tasks. A system sized for summer comfort will leave you cold and dark from November through February.
Step 5 — Evaluate and integrate supplemental sources
Solar alone leaves two blind spots: night and winter cloud cover. Strategically adding a second generation source changes the risk profile of the entire system.
Wind integration
Wind and solar are naturally complementary in many climates: winter storms bring both clouds and strong wind, and nighttime wind compensates for zero solar production. If your site averages 10–12 mph (4.5–5.4 m/s) or higher at hub height, a small wind turbine can meaningfully reduce battery drawdown during solar's worst periods.
A 1 kW wind turbine on an adequate wind site produces roughly 150–250 kWh per month — enough to cover 30–50% of the critical loads in the example above. See the small wind turbines page for site assessment methodology and the DOE 10 mph (4.5 m/s) minimum threshold.
Wind and solar share the same battery bank and charge controller bus. Most modern MPPT charge controllers handle both sources simultaneously via separate input terminals. A hybrid controller with separate PV and wind inputs simplifies the wiring.
Micro-hydro integration
If your property includes a stream or creek with year-round flow and at least 10 feet (3 m) of vertical head, micro-hydro is the most powerful supplemental source available. Unlike solar and wind, micro-hydro produces continuous power — 24 hours a day, every day, regardless of weather.
Power output calculation:
Output (W) = Head (ft) × Flow (GPM) ÷ 10 (simplified — assumes ~60% system efficiency)
A modest stream with 20 feet (6 m) of head and 50 GPM of flow:
20 × 50 ÷ 10 = 100W continuous = 2.4 kWh/day
A site with 50 feet (15 m) of head and 100 GPM:
50 × 100 ÷ 10 = 500W continuous = 12 kWh/day — more than the critical load in the example above
The tradeoff is seasonal reliability: summer drought can reduce stream flow to a fraction of spring levels. A micro-hydro system on a stream that reliably flows year-round can dramatically reduce the required solar array size and battery bank. See micro-hydro power for site qualification, turbine selection, and penstock sizing.
Generator backup
Every whole-home off-grid system needs a generator for three conditions: 1. Extended low-production events (3+ consecutive days of cloud cover with no wind) 2. Deep battery bank recovery after a multi-day event 3. High-surge loads (welders, large air compressors, stump grinders) that would otherwise require a much larger inverter
Generator sizing rule: Generator continuous output must equal or exceed the inverter-charger's maximum AC charging input plus simultaneous critical loads.
For an inverter-charger charging at 5,000W (100A at 48V) with 1,500W of critical loads running simultaneously:
Generator minimum: 5,000 + 1,500 = 6,500W — specify a 7,500W unit with 15% headroom
A propane-primary dual-fuel generator fed from a 500-gallon (1,893-liter) tank provides indefinite backup fuel with no degradation. Propane stores without stabilizer, whereas gasoline in a generator fuel tank starts degrading within 3–6 months. A 500-gallon (1,893-liter) propane tank holding enough fuel to run a 7,500W generator at 50% load for roughly 250–300 hours gives substantial winter backup coverage.
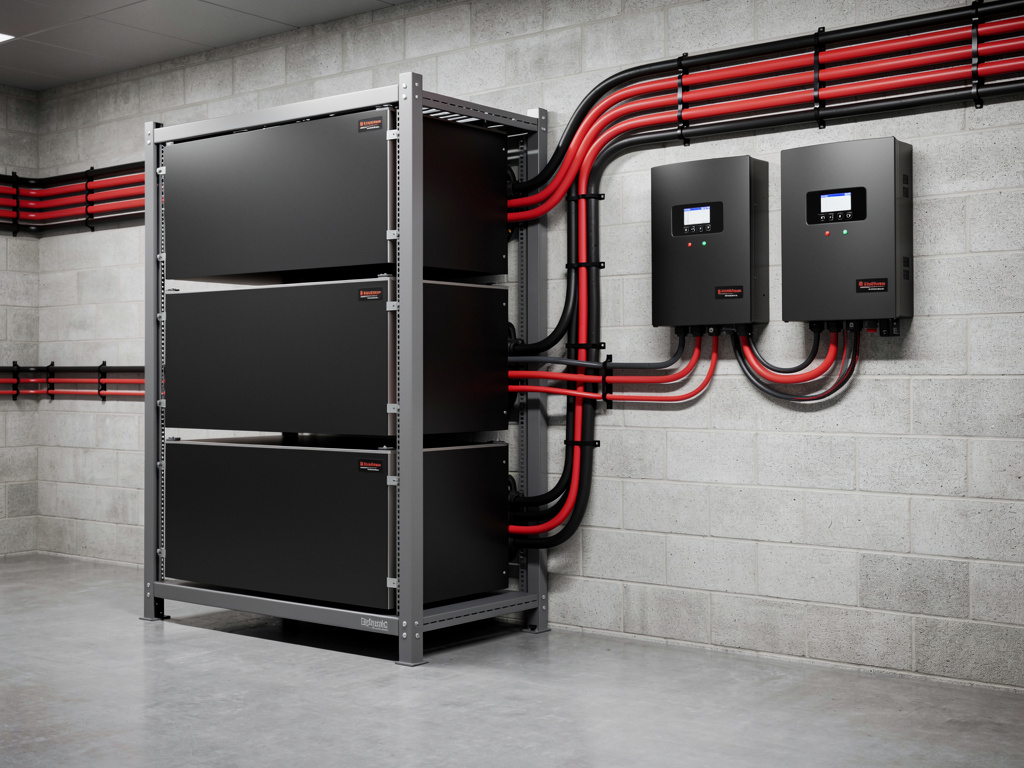
Step 6 — Wiring architecture overview
Off-grid systems have two distinct wiring circuits that must remain completely separate throughout the system: the DC bus and the AC distribution.
DC bus (48V): All generation sources — PV array, wind turbine, micro-hydro turbine — connect via MPPT charge controllers to the 48V battery bank bus. The inverter-charger also connects to this bus on its DC input side. This bus operates at 48V and high DC current. National Electrical Code (NEC) Article 690 governs PV source circuit wiring, requiring appropriate wire types (USE-2 or PV wire for outdoor exposed runs), conduit fill requirements inside structures, and a DC disconnect within sight of the inverter.
Key DC wiring rules: - Use copper conductor only; aluminum corrodes at low-voltage battery terminals - Fuse every source circuit and every battery output circuit as close as practicable to the positive terminal — industry practice targets within 18 inches (46 cm) per NEC 240.86 and ABYC E-11 - Keep DC cable runs short — every foot of cable adds resistance and losses - Use torque specifications on all battery and busbar terminals; under-torqued connections arc and fail
AC distribution: The inverter-charger output connects to a critical-load subpanel — a dedicated breaker box fed exclusively by the inverter. This subpanel powers critical and essential loads. Discretionary loads remain on a separate conventional panel that is either fed from a generator transfer switch or simply left off-grid when grid connection is absent.
The critical-load subpanel approach has three advantages: 1. The inverter only powers what it needs to — smaller inverter, lower idle losses 2. Discretionary high-draw loads (dryer, oven) can never accidentally overload the inverter 3. In a hybrid setup with grid connection, the inverter seamlessly transitions critical loads to battery without affecting the rest of the house
See inverters for pure-sine wave requirements, continuous vs. surge sizing, and installation sequence including the mandatory DC fuse placement.
Separate AC and DC wiring inside the structure
NEC 690 requires that DC PV conductors and AC inverter output conductors be run in separate raceways or conduits inside a building or structure. Running 48V DC and 120/240V AC conductors in the same conduit creates a code violation and a shock hazard. Label all DC conduits clearly — DC arc faults are more dangerous than AC faults at equivalent voltage because DC current does not self-extinguish at current zero-crossings.
Step 7 — System monitoring and data logging
An off-grid system without monitoring is flying blind. You need to know battery state of charge, daily production, daily consumption, generation source contributions, and any fault conditions — in real time and historically.
Minimum monitoring for a whole-home system:
- Shunt-based battery monitor (Victron BMV-712 or equivalent): measures state of charge, current in/out, amp-hours consumed since last full charge. Mount the shunt in the negative cable between the battery bank and all loads/chargers.
- Charge controller display or data port: shows daily PV production (kWh) and battery charging state.
- Inverter display: shows current AC load watts and any fault/alarm conditions.
Recommended: networked monitoring platform. Victron VRM (free with any Victron inverter), Midnite Solar CLASSIC monitor, or Schneider Electric InsightHome all log production, consumption, and battery trends accessible from a phone app. Set these automatic alerts:
- Battery SoC drops below 30% → generator start alert
- Battery SoC drops below 20% → inverter low-voltage alarm (automatically starts generator if auto-start is wired)
- AC load exceeds 80% of inverter continuous rating → overload warning
- Battery temperature exceeds 95°F (35°C) or drops below 40°F (4°C) → temperature alarm
Data logging matters for long-term health. A monthly log of: highest SoC reached (ideally 100% or near), lowest SoC reached, generator runtime hours, and any battery alarms tells you whether the system is healthy or drifting. A bank that used to reach 100% SoC every sunny day but now only reaches 85% is losing capacity — visible only when you have historical records to compare against.
Step 8 — Maintenance calendar
A whole-home off-grid system requires regular maintenance at each component tier. Deferred maintenance compounds quickly: a corroded terminal leads to a voltage drop, which trips the inverter, which discharges the batteries overnight.
Monthly: - [ ] Inspect all battery terminal connections for corrosion, heat discoloration, or looseness. Re-torque if any doubt. - [ ] Verify BMS display shows all cells within 50 mV of each other at full charge (LiFePO4) - [ ] Check inverter event log for any faults or alarms during the past month - [ ] Verify charge controller shows daily production consistent with expected seasonal output - [ ] For flooded lead-acid: check electrolyte levels and top off with distilled water only
Quarterly: - [ ] Run a known-load runtime test: discharge the battery bank to 20% SoC under a measured load, record Ah delivered, compare to calculated baseline - [ ] Inspect all DC and AC cable insulation for cracking, chafing against conduit edges, or UV degradation on exterior runs - [ ] Test generator: run under full charging load for 30 minutes; verify output voltage (120/240V ± 5%) and that auto-start/stop cycles correctly - [ ] Inspect PV panels for bird droppings, lichen, shading from new tree growth, or cracked glass. Clean with soft brush and water if soiled. - [ ] Check micro-hydro inlet screen and penstock intake for debris (if applicable) - [ ] Inspect wind turbine tower for loose guy wire tension and check turbine rotation and braking (if applicable)
Annually: - [ ] Full battery capacity test: discharge to minimum SoC under measured load; compare Ah delivered to nameplate. Below 80% of nameplate signals end-of-life planning. - [ ] Torque all battery terminal bolts and busbar connections to specification - [ ] Test all DC and AC breakers and fuses by manually tripping and resetting; replace any that don't reset cleanly - [ ] Change generator engine oil, air filter, and spark plugs (typical interval: 100–200 hours of runtime or 12 months) - [ ] Inspect roof penetrations and conduit seals for water infiltration - [ ] Review system logs: compare actual winter and summer production to design targets; identify any drift
Step 9 — Expansion planning
Design your initial system to accommodate growth without rebuilding from scratch. Off-grid systems scale in two directions: more generation (more panels or sources) and more storage (more battery capacity).
Expandable design choices to make from day one:
- Oversize the inverter-charger. An inverter-charger running at 50% of its rated output runs cooler, more efficiently, and lasts longer than one running at 95%. Leaving headroom allows you to add loads without replacing the inverter.
- Install a combiner box for the PV array with room for additional strings. Adding two more panels should require connecting two wires to an available terminal, not rewiring the whole array.
- Size the battery enclosure for twice your initial bank. LiFePO4 server rack batteries add in parallel — physically room to double matters.
- Plan the critical-load subpanel with spare breaker slots. A subpanel that's full on day one is a subpanel you'll need to replace when you add a load.
- Document everything. A wiring diagram taped inside the electrical enclosure with component labels, cable gauge notation, and fuse ratings is worth hours of troubleshooting three years from now.
Step 10 — Cost modeling and payback
A whole-home off-grid system is a significant investment. Understanding what drives cost and where realistic payback occurs helps you design to a budget rather than discover the number at the end.
Component cost tiers by system scale (DIY labor only):
Solar array and storage sizing by system scale:
| System scale | Solar array | Battery bank |
|---|---|---|
| Critical loads only (~5 kWh/day) | 2–3 kW | 10–15 kWh |
| Modest full household (~10 kWh/day) | 4–6 kW | 15–25 kWh |
| Larger household + workshop (~15 kWh/day) | 8–12 kW | 25–40 kWh |
| Full homestead (~20+ kWh/day) | 12–20 kW | 40–80 kWh |
Inverter-charger sizing and total cost tier:
| System scale | Inverter-charger | Total cost tier |
|---|---|---|
| Critical loads only (~5 kWh/day) | 3–5 kW | moderate investment |
| Modest full household (~10 kWh/day) | 5–8 kW | significant investment |
| Larger household + workshop (~15 kWh/day) | 8–12 kW | significant investment |
| Full homestead (~20+ kWh/day) | 10–15 kW | significant investment |
Professional installation adds significant cost on top of components — typical rates run per-watt on the array and hourly on balance-of-system work. DIY installation is achievable for homeowners comfortable with electrical work, but requires understanding NEC 690 (PV wiring), conductor sizing, grounding, and labeling requirements. The DIY solar installation page covers the permitting and code compliance sequence.
Payback context. For properties already connected to the grid, the payback calculation compares system cost against displaced electricity bills. At average US residential electricity rates and typical system costs, grid-connected solar with battery backup (hybrid systems) reaches payback over a period of years that depends heavily on local electricity rates, system size, and applicable incentive programs. Verify current federal and state incentive programs at energy.gov before finalizing your cost model — incentive programs change and can significantly affect effective system cost.
For properties where utility connection would cost a significant investment to extend service across a rural parcel, the payback comparison changes entirely: the off-grid system competes against a one-time utility extension cost, and the answer is often immediate.
Where off-grid energy systems create non-financial returns: - Energy independence from utility rate increases and outages - No grid extension cost for remote parcels - Ability to power water pumps, refrigeration, and medical equipment indefinitely - Foundation for homestead economics — not just a backup, but the primary infrastructure
System design checklist
- Complete a room-by-room load audit with actual watt measurements where possible; calculate separate summer and winter daily totals
- Separate all loads into critical / essential / discretionary tiers; design the system around critical loads
- Choose LiFePO4 chemistry for systems cycled daily; confirm BMS includes low-temperature charging cutoff
- Size battery bank: critical load × autonomy days ÷ usable DoD, plus 15–20% buffer
- Design at 48V for any system above 2 kW or 10 kWh; size cables at 125% of continuous current
- Size solar array for worst-month PSH at your location; derate by 0.80 for real-world losses
- Assess site for supplemental wind or micro-hydro; target complementary seasonal production profiles
- Size generator at inverter-charger maximum charge rate plus simultaneous critical loads; specify propane-primary for long-duration fuel storage
- Wire a dedicated critical-load subpanel; keep DC and AC conductors in separate raceways
- Install shunt-based battery monitor with networked data logging; set automatic alerts for low SoC and temperature extremes
- Build and post a printed maintenance calendar at the battery bank; log every maintenance action with date
- Document all wiring, component ratings, and configuration settings in a laminated reference inside the electrical enclosure
A well-designed whole-home off-grid system begins with the individual components but succeeds as an integrated system. The off-grid solar systems page covers off-grid solar architecture decisions and autonomy sizing in depth, batteries covers chemistry selection and cell-level wiring safety, inverters covers pure-sine sizing and installation sequence, small wind turbines covers site assessment and integration, and micro-hydro power covers run-of-river qualification for properties with streams. The combination of all five gives you every resource needed to move from load audit to commissioned system.
Year 2–10+ planning: degradation, replacement, and supply-chain resilience
A whole-home off-grid system that runs perfectly in year one will fail predictably in year five to ten if you do not plan for the components that wear out. The math is unambiguous: charge controllers, inverters, and battery banks represent 30–50% of total system cost and have service lives of 8–15 years. Solar panels are the cheapest to maintain over their 25–30 year warranty life, but the most disruptive to swap because they require roof or ground-mount disassembly. Planning for replacement is not pessimism — it is the difference between a system that runs for 25 years and one that gets abandoned at year eight when the inverter dies and the replacement cost is a surprise.
Component lifespan reference
The table below summarizes realistic field service life by component class, the primary failure mechanism, and the approximate share of a typical whole-home system cost that component represents. Lifespans assume proper installation, site-appropriate environmental protection, and the maintenance cadences described in Step 8.
| Component | Typical field lifespan | Primary failure mode | Approx. share of system cost |
|---|---|---|---|
| Solar panels (modern monocrystalline) | 25–30 years | 0.3–0.5%/year output degradation; encapsulant browning at year 20+ in high-UV climates | 20–30% |
| MPPT charge controller | 10–15 years (industrial-grade units often exceed 20 years) | Electrolytic capacitor drying; surge damage; firmware obsolescence on older communication protocols | 5–10% |
| String or hybrid inverter-charger | 10–12 years | Capacitor aging — electrolyte evaporation increases equivalent series resistance, generating heat that accelerates failure; control board failures in high-temperature installs | 15–25% |
| Microinverter (AC module type) | 15–25 years | Generally the most durable inverter architecture; most manufacturer warranties cover 25 years | 15–25% |
| LiFePO4 (lithium iron phosphate) battery bank | 10–15 years at daily cycling; some manufacturer specs cite 4,000–6,000 cycles to 80% capacity | Capacity fade from cycle wear and high-temperature aging; BMS firmware obsolescence at year 10+ | 30–45% |
| AGM (absorbed glass mat) lead-acid | 5–8 years at off-grid daily cycling | Sulfation from chronic undercharging; accelerated capacity loss above 40°C (104°F) | 20–25% |
| Flooded lead-acid (with maintenance) | 7–15 years | Sulfation; water consumption requires active electrolyte management; plate corrosion in chronic overcharge | 15–22% |
| DC wiring, conduit, and connectors | 25–40 years (copper conductors) | UV degradation of outdoor-exposed jacketing and MC4 connectors; galvanic corrosion at dissimilar-metal terminations | 1–3% |
| Mounting and racking | 25–40 years (aluminum) | Galvanic corrosion at roof penetrations; sealant failure at flashing; fastener fatigue on high-snow-load roofs | 5–10% |
| AC distribution panel and breakers | 30–40 years | Bus-bar corrosion in humid environments; breaker mechanism fatigue from repeated trips | 3–5% |
| Backup generator | 10–15 years (with regular service) | Engine wear from long idle periods; control board failure on older electronically governed models | 10–15% |
Field note
LiFePO4 lifespan varies enormously by operating temperature. A bank that routinely charges at temperatures below 32°F (0°C) without a low-temperature cutoff will suffer lithium plating — an irreversible degradation that can cut projected lifespan by half. A bank that spends summer in a 120°F (49°C) enclosure will see similar acceleration. Install battery temperature monitoring and locate the bank in a climate-moderated space where ambient stays between 50°F and 77°F (10°C and 25°C) year-round if possible. This single factor affects lifespan more than any other.
Year-by-year replacement cadence
The following timeline describes a typical 10 kW whole-home off-grid system with a 20 kWh LiFePO4 battery bank. Adjust by chemistry choice (AGM banks need replacement at year 5–8 instead of year 10–15) and by installation environment (harsh conditions accelerate all timelines).
Years 0–2 — Burn-in. No component replacements expected. Manufacturer warranty covers production defects during this period. Focus on monitoring data: verify that peak battery state of charge reaches 100% on good production days and that charge controller logs show daily production within 10% of design targets. Establish the baseline log records that will make future capacity fade visible.
Years 3–5 — Minor parts only. Expect small consumable replacements: one or two MC4 connectors that develop intermittent resistance (visible as hot spots on an IR camera scan), one or two GFCI outlets or arc-fault breakers that trip and fail to reset. Generator oil, air filter, and spark plugs are due every 100–200 runtime hours regardless of age. Annual parts budget at this stage is small — roughly the cost of a basic service kit plus any consumables found during quarterly inspections.
Years 6–8 — Pre-replacement planning window. The charge controller is entering the latter portion of its design life. If the unit was mid-tier (Chinese-manufactured with unknown electrolytic capacitor grade), plan for replacement. Signs of approaching capacitor failure include audible high-frequency buzz from the controller, reduced MPPT efficiency (actual daily production drifting below logged baseline without shading or soiling changes), or occasional spontaneous reboots. The battery bank is at approximately 80–90% of original nameplate capacity for a well-maintained LiFePO4 system — within spec, but now declining measurably. Begin building a cash reserve for the year 9–12 replacement window.
Years 9–12 — Major replacement cycle. For most systems, this is the single most expensive maintenance period in the first 25 years:
- Battery bank replacement is likely — LiFePO4 rated to 3,500–6,000 cycles reaches that figure at 10–16 years of daily cycling. A bank that consistently discharged to 50% DoD rather than 80–90% DoD will be at the high end; a bank that routinely ran to minimum cutoff will be near the low end.
- Inverter-charger replacement is likely — capacitor-driven failures appear commonly in the 10–12 year range for continuously-operated units.
- Charge controller replacement if not already done in years 6–8.
Budget for this window as a known capital event, not an emergency. See the reserve fund section below.
Years 13–15 — Second-generation electronics. The replacement charge controller and inverter installed in years 9–12 are now entering their own mid-life. If microinverters were used instead of a string inverter-charger, they may still be within warranty. Monitor the annual capacity-test log (from Step 8's maintenance calendar) to confirm the replacement battery bank is holding capacity.
Years 16–20 — Panel monitoring and second mid-life check. Solar panels are at 85–90% of original rated output at year 20 for modern panels with 0.3–0.5% annual degradation rates (NREL field data). Individual panels may show visible cell cracking or delamination — inspect annually. The system is now on its second-generation electronics; monitor for early signs of another inverter replacement cycle.
Years 20–25 — Panel end-of-warranty and full repowering decision. Most panels reach the end of their 25-year performance warranty at this stage. They continue to produce — but at 80–87% of nameplate. The decision between continuing to operate aging panels, replacing individual underperformers, or full array repowering depends on system economics at that time. DC wiring and mounting hardware installed to code may still have 15–20 years of service life remaining and can typically be reused in a repowering project.
Reserve fund modeling
The most effective way to absorb major replacement costs without financial disruption is to treat the system like a capital asset with a scheduled replacement reserve — the same approach used for roofing, HVAC, or a vehicle fleet.
Annual reserve target: For a system installed at a moderate-to-significant investment level, building an annual reserve fund of 6–10% of original installed cost is a practical rule of thumb. This range covers the major battery and inverter replacements that land in the year 9–12 window while keeping annual contributions manageable.
Allocation by component class:
- 40% of annual reserve toward battery bank replacement
- 30% toward inverter and charge controller replacement
- 15% toward panel, mounting, and roof-penetration maintenance
- 10% toward small parts, wiring, and connectors
- 5% toward permitting, inspection, and licensed labor for replacement work
Replacement cost perspective. Battery and inverter technology prices have trended downward over time. The replacement cost in year 10 may be meaningfully lower in real terms than the original installation cost for the same capacity — a partial offset against the reserve fund requirement. Do not count on this, but do account for it when the time comes by getting current quotes rather than indexing to original costs.
Supply-chain resilience
Off-grid systems depend on commercial supply chains that are not crisis-proof. This matters most when the grid is down and the replacement part is unavailable locally.
Premium-brand components have longer procurement lead times. Units from established manufacturers — Victron Energy, Schneider Electric/Xantrex, Outback Power, MidNite Solar, EG4 — are well-supported through authorized dealer networks, but specialty units may require ordering through distributors with 4–12 week lead times during high-demand periods. Lower-tier components available through mass-market channels typically ship faster but carry higher failure rates and less predictable availability over a 15-year horizon.
Product lines change across a system's lifespan. A charge controller or inverter purchased today will likely go through one or more product generations before the system reaches end-of-life. When a specific model is discontinued, the replacement path is the current-generation equivalent — but the installer must verify three things before substituting:
- Voltage compatibility. The new unit must match the system bus voltage (most whole-home systems run 48V DC). Verify that charge voltage profiles are compatible with the installed battery chemistry and BMS communication requirements.
- Communication protocol compatibility. Modern battery management systems communicate with inverters and charge controllers via CAN bus or Modbus RTU/TCP protocols. A replacement unit that uses a proprietary protocol instead of open standards may not integrate with an existing battery BMS, requiring a protocol gateway or battery replacement alongside the inverter.
- Physical and regulatory fit. The replacement unit must install per its listing (NEC 110.3(B)) and fit the existing enclosure, conduit knockouts, and available mounting space. A new unit that requires a larger disconnect or different conduit fill may trigger a partial wiring upgrade under the inspection authority's jurisdiction.
On-site spares strategy. Keeping spare units of every major component is neither practical nor cost-effective for most installations. A targeted spares inventory reduces the most likely failure impacts without large capital tie-up:
- Keep one spare MPPT charge controller on site if budget allows — they are the most likely single-point failure in the 8–15 year window and are compact to store. The spare should match the installed unit's input voltage range and communication protocol.
- Keep a stock of DC breakers and fuses in the sizes used throughout the system. Generic industrial-grade breakers from major manufacturers fit most 4-pole enclosures and remain available indefinitely.
- Keep a roll of PV wire (USE-2 or PV wire rated for outdoor exposure) in the most common gauge used in the array source circuits, plus a supply of MC4 connectors and a dedicated MC4 crimp tool. Connector failures are more common than panel failures and are a quick field repair.
- Do not stockpile replacement battery cells or modules as a long-term strategy. Lithium chemistry cells age on the shelf even without cycling. A cell stored for three to five years before installation will have already lost a portion of its calendar life.
Field note
Manufacturer-independent components are your insurance against product discontinuation. Copper conductors, standard-thread wire-clamp lugs, and industrial breakers from Square D, Eaton, or equivalent remain available across decades. The proprietary pieces — BMS communication cables, inverter control harnesses, specific torque connector hardware — are the items to keep spare sets of while the product line is still active.
When major components fail and parts aren't immediately available
Plan for the gap between a major component failure and its replacement. The relevant variables are failure severity and procurement lead time.
| Scenario | Lead time | Recommended response |
|---|---|---|
| Single charge controller failed; array still partially operational via second controller | Days to weeks | Reduce loads to match reduced charging capacity; prioritize critical loads; order replacement immediately |
| Inverter-charger failed; generator operational | Days to weeks | Run generator on a scheduled basis to power critical loads directly via AC; order replacement; avoid running generator 24/7 (fuel cost and engine wear) |
| Inverter-charger failed; no generator | Weeks to months | Highest-urgency procurement situation; run DC loads directly from battery bank via 12V/48V loads where possible; rent or borrow a portable generator for critical loads during the gap |
| Battery bank at end of life; inverter and panels functional | Months (major procurement) | Plan this replacement well before failure; a battery bank that reaches 60% of nameplate capacity can often limp through one more winter season if loads are aggressively managed; do not wait for complete failure |
| Multiple major components failed simultaneously | Varies | Evaluate repair vs. full system upgrade — on a system 12+ years old with multiple simultaneous failures, the total cost of piecemeal repair often approaches or exceeds the cost of a current-generation replacement system |
The system design choices in Step 9 (expansion planning) directly affect resilience in failure scenarios. An inverter-charger sized at 50% of its rated continuous output runs cooler, lasts longer, and — when it does fail — can often be temporarily substituted by a smaller portable inverter for critical loads while awaiting replacement.
For detailed battery replacement cost modeling and end-of-life timing decisions, see batteries. For panel degradation curves, warranty milestone guidance, and repowering economics, see the NREL degradation rate data at pvwatts.nrel.gov and the panel performance documentation maintained by your panel manufacturer.
Failure modes
Winter generation shortfall from under-designed array — Recognition: battery state of charge drops below 50% on multiple consecutive days in January; charge controller logs show less than 20% of the target daily Ah delivered for the month; the system runs the generator more than 3 days per week during winter. Remedy: re-size the array using worst-month peak sun hours from NREL PVWatts for your exact location; oversize the array 15–30% beyond the annual-average figure to buffer worst-case winter; add generator backup sized for 25–50% of the daily critical load to cover the residual gap.
Battery bank deep-cycle damage from incorrect depth of discharge — Recognition: LFP bank capacity falls below 80% of nameplate rating before 500 cycles; lead-acid specific gravity stays low even after equalization; bank temperature spikes during heavy discharge. Remedy: set the inverter low-voltage cutoff so the battery bank never drops below 10% state of charge (LFP) or 50% state of charge (lead-acid) per chemistry manufacturer datasheets; install a BMS with cell-level monitoring and automatic low-SoC disconnect.
Generator-inverter handoff failure during extended low-production events — Recognition: generator starts but inverter does not transfer critical loads; loads experience a gap of 100 ms or more; sensitive electronics reboot or reset during transitions. Remedy: configure the inverter-charger's auto-transfer-switch timing to match your load profile; verify generator total harmonic distortion (THD) is below 5% for sensitive electronics; test the full handoff cycle under representative load at least monthly during the heating season.
Permit and inspection failure at final approval — Recognition: AHJ inspector flags missing labeling, undersized disconnects, or non-compliant grounding electrode conductor at final inspection; system is commissioned but cannot be legally energized. Remedy: build to NEC 690 (solar PV), NEC 706 (energy storage systems), NEC 710 (stand-alone systems), and NFPA 855 (residential ESS installation standard) from the start; verify all circuit labeling per NEC 690.13 and 690.31(C) before inspection; ground per NEC 250.166 and NEC 690.43 with conductor sizing documented on the single-line diagram.
Silent under-performance from absent system monitoring — Recognition: no remote dashboard or historical data logging is configured; undercharging or capacity loss is discovered only when the battery bank fails to power loads overnight; charge controller logs exist locally only. Remedy: install a shunt-based battery monitor (Victron BMV-712 or equivalent) with networked data export; connect the inverter-charger to the manufacturer's cloud monitoring platform; configure automatic alerts for SoC below 30%, any charge controller fault, and BMS over-temperature or cell-imbalance events.